The Quarterly Autopsy
Why your reports arrive after the patient is dead, and how event-driven organisations respond while it still matters

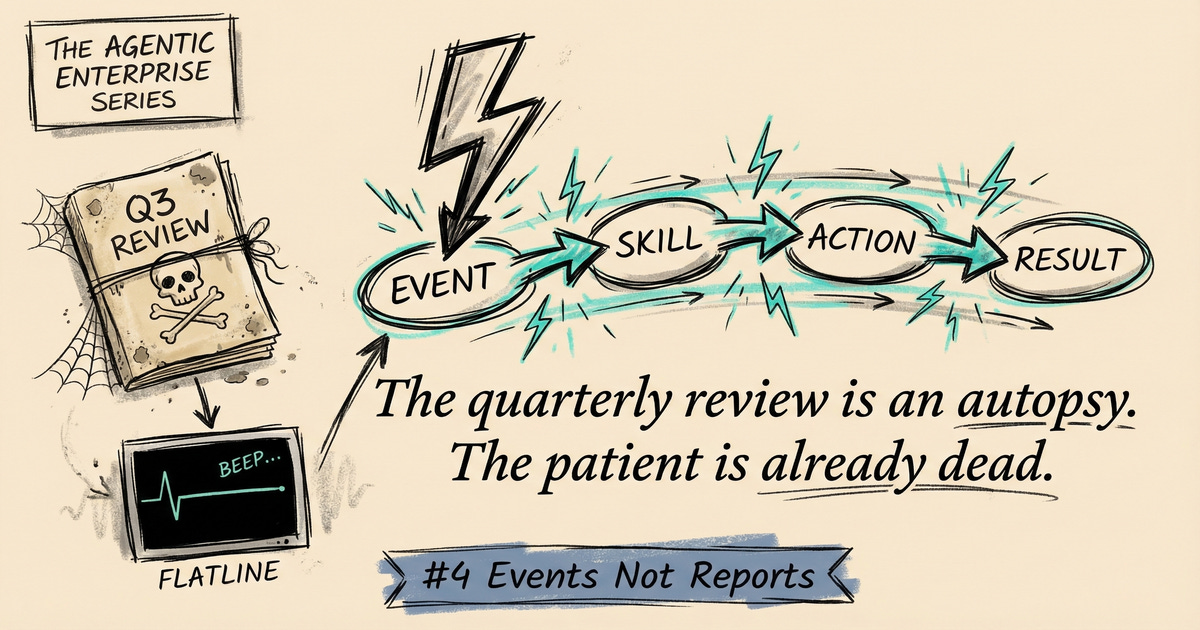
Deep Dive #4 in “The Agentic Enterprise” Series
A few years back, our team was brought into a logistics company in Hamburg to help modernise their warehouse metrics. The setup was familiar: every night, a batch job pulled the day’s numbers from the warehouse management system into an Oracle staging database. Every morning, a reporting team ran their queries and built the Excel sheets. Every quarter, those Excel sheets became slide decks.
The warehouse supervisors knew their operation was drifting. Mis-pick rates had been climbing for some time. But the data lived in a nightly batch cycle, the reports lived in a quarterly cadence, and the people who could act on the numbers never saw them until the pattern had already done its damage.
When we proposed replacing the batch pipeline with a streaming architecture, Kafka topics feeding real-time dashboards, the database team pushed back hard. Their lead, a careful man who’d maintained that Oracle instance for eleven years, told us flatly: “You’re going to break reporting for the whole company.” He wasn’t wrong to worry. His batch jobs were the single source of truth for every downstream report, every KPI dashboard, every board pack. Ripping that out felt reckless to people who’d spent a decade keeping it stable.
We didn’t rip it out. We ran both systems in parallel for three months. The streaming pipeline fed a new operational dashboard. The batch pipeline kept feeding the quarterly reports. Within six weeks, the warehouse floor was catching anomalies in hours instead of quarters. The mis-pick rate dropped from 2.3% to 1.4%. The operations lead told us, slightly amazed, “We didn’t change any processes. We just started seeing things when they happened instead of when the slides were ready.”
The quarterly review is an autopsy. By the time you read the report, the patient is already dead.
The Latency Tax
A typical reporting cycle works like this. Data is generated continuously. Customer behaviour, operational metrics, pipeline numbers, incident logs. All of it flows into databases and spreadsheets where it sits until someone aggregates it at the end of a period. Someone formats the aggregation into slides. A meeting is scheduled. People look at what happened six to twelve weeks ago. Actions are assigned. Follow-up happens next cycle.
The gap between “something happened” and “we understood it and responded” is thirty to ninety days.
In any technical system, that would be a critical bug. If your web server took ninety days to respond to an HTTP request, you would not call it governance. You would call it catastrophically broken. The technical term is latency, and every system has a latency budget. Payment processors: milliseconds. Air traffic control: seconds. For most organisational processes, nobody has ever set the latency budget, so it has drifted into weeks and months by default.
The Hamburg warehouse had been losing money on mis-picks for months before anyone with authority to act saw the numbers. The fix, once the streaming data made the pattern visible, took four days.
What Event-Driven Architecture Learned First
Software engineers solved their version of this problem in the 1990s with event-driven architecture. Instead of systems polling each other on a schedule (”what happened since last time?”), systems emit events when state changes (”this just happened”) and subscribers react immediately. Latency collapses from the polling interval to near-zero.
John Boyd’s OODA loop captures the same dynamic for organisations. Observe, Orient, Decide, Act. Boyd’s key insight was competitive: if you cycle through OODA faster than your adversary, you get inside their decision loop. They react to your last move while you execute your next one. A company that observes weekly, orients monthly, decides quarterly, and acts through a budgeting process is not slow because its people are slow. It is slow because its OODA loop has been structurally constrained to the frequency of its reporting cycles.
Most organisations miss a crucial distinction here. Monitoring is not responding. They invest in dashboards and believe they have solved the latency problem. They have solved observation while leaving orientation, decision, and action untouched. A customer NPS score dropping three points is not a datum for next month’s report. It is an event that should trigger investigation and outreach now.
The Pattern: Event-Driven Organisational Architecture
In Hamburg, once the streaming pipeline was running alongside the old batch system, the operations team started doing something they’d never done before: defining thresholds that triggered action, not reports.
They picked five signals from the warehouse operation: mis-pick rate, order cycle time, return-processing backlog, commissioning speed, and staff overtime hours. For each signal, they set a trip-wire. Not a KPI target for the board pack, but the level at which the signal constitutes an event requiring investigation. Mis-pick rate above 2.1% for three consecutive days. Overtime exceeding 15% of scheduled hours in any week.
They pre-defined the response for each threshold breach. Who gets notified. What investigation is triggered. What immediate containment action is taken. All designed in advance, when the team had time to think clearly, not in the heat of the event.
The database team watched from the sidelines, sceptical. Their batch jobs still ran every night. The quarterly reports still got built. But within a few months, nobody was waiting for them. The warehouse floor had already acted on the same data days or weeks earlier. The Oracle lead eventually came around. “I’m not against real-time,” he told us over coffee. “I was against losing the audit trail.” We kept both. The batch system became the compliance archive. The streaming system became the operational nerve centre.
The biggest resistance to event-driven operations came not from the business side, but from the infrastructure team that controlled the data. They weren’t protecting the quarterly review. They were protecting the system they understood.
How Agentic Cells Make This Real
Event-driven operations worked in Hamburg. But Hamburg had a dedicated operations lead, a motivated warehouse team, and us pushing the streaming architecture. The cognitive load was enormous. One person watched the dashboards. Another evaluated whether a threshold breach was noise or signal. A third decided who to call. Scale that to an organisation with forty operational domains and the model collapses. You run out of people before you run out of signals.
AI agents remove that bottleneck.
Think about what happened in Hamburg, but with an agent layer underneath. The five signals we tracked manually become five hundred. Customer churn by segment, by product, by region, by acquisition channel. Commissioning speed per shift, per warehouse zone, per equipment type. An agent monitors all of them simultaneously, applying consistent threshold logic without fatigue, without the 3 a.m. attention drift that made our night-shift dashboards unreliable.
When a signal crosses a threshold, the agent does more than fire an alert. It pulls context. What else shifted in the same timeframe? The return-processing backlog spiked on Tuesday, but so did inbound volume from a promotional campaign. The agent connects those events and presents the operations cell with a situation briefing, not a raw number. In Hamburg, assembling that context took our team half a day of querying the Oracle archive. An agent does it in seconds.
For well-understood event types, the agent acts without waiting. Support ticket volume spikes. The agent scans the tickets for common patterns, identifies whether the root cause is a product defect or a process breakdown, and routes to the appropriate cell with a preliminary diagnosis attached. The cell gets a half-solved problem instead of a blinking alert.
The correlations are where it gets interesting. Employee absence patterns tracking with deployment frequency. Customer churn in one segment moving in lockstep with a pricing change in another. No individual holds enough context across those domains to spot the connection. An agent scanning structured event logs across the organisation can surface it and flag it for human investigation.
Each agentic cell runs its own OODA loop. The AI layer handles Observe and the initial Orient phase at machine speed. Humans focus on Decide and Act, the phases where judgment and local knowledge still matter. The loop cycles in hours, not quarters. The Hamburg operations lead, who spent her mornings manually checking dashboards, would instead spend that time on the problems the agents couldn’t resolve: the ambiguous thresholds, the novel failure modes, the situations where no response protocol exists yet.
The quarterly review does not disappear. It shifts from operational reporting to strategic calibration. Are we monitoring the right signals? Are our thresholds set correctly? Are our response protocols effective? The meeting changes from “what happened last quarter” to “how well is our sensing system performing, and what should we change about it?”
Start small. Pick one operational signal that currently lives in a monthly report. Define the threshold. Wire it to an alert. Assign an AI agent to assemble context when the threshold is crossed. Assign a named human response. Run it for a month. You will learn more about event-driven operations from that single experiment than from any amount of planning.
The quarterly review can stay for strategy. Just stop using it for operations.
Next in the series: Deep Dive #5, The 80/20 Nobody Budgets, on why every capability needs two modes, and what happens when you only fund the one that keeps the lights on.